There are striking differences in the age and gender composition across Cork City, with an abundance of male, young and single people in the city centre. The absence of children, women and older people leads to several intersecting inequalities in access to education, work and housing that are effectively a tax on girls, women, disabled and old people. The increasing focus on single and small apartments – which may seem oppressive or even dangerous to women and disabled people – is transforming the city and the centre into a population of transients. The lack of family, own-front-door and accessible dwellings means that most of life’s transitions – forming a relationship, having a child, unemployment, retirement, disablement or long-term illness – necessitate a move, and the only available and appropriate dwellings are either in poor repair, or increasingly further away from the centre.
The renewal of small parts of Cork City disguises an ongoing decline and dereliction of large swathes of the city, with poor maintenance and high rents increasing the volume of substandard single occupancy dwellings in divided former family dwellings, high levels of neglected vacant property, and indeed physical collapse of older buildings.
Girls, women, disabled and older people experience a double burden of excess journey times to education, work and essential services, as a direct consequence of moving out of a centre and out of a city that increasingly lacks appropriate and secure housing.
A change in decision-making to more adequately include all parts of the community would change the direction of planning. The much-parroted term ‘sustainability’ is a nonsense when the city is unable to sustain its own residents across changes in family structure, sickness and employment.
(Click on the graphs or maps to enlarge them.)
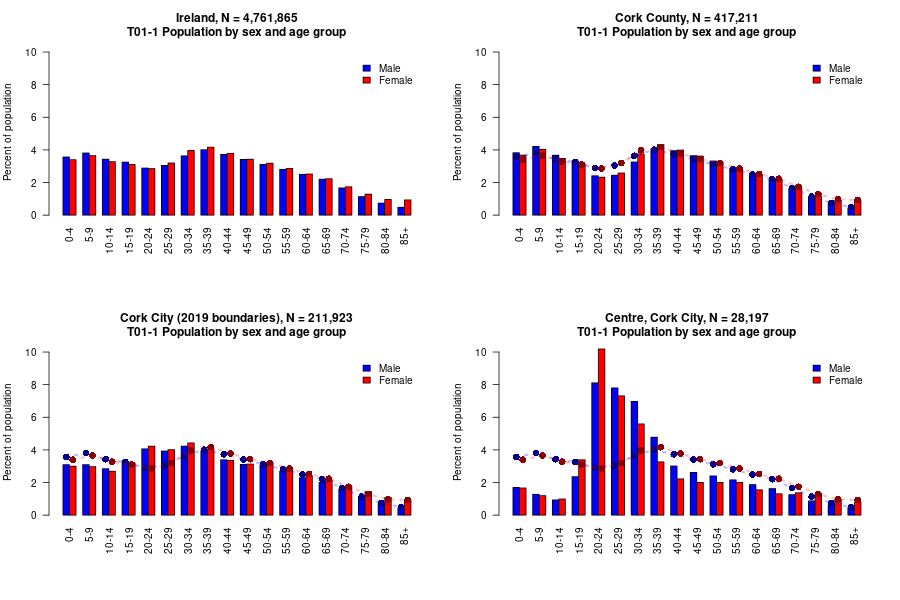
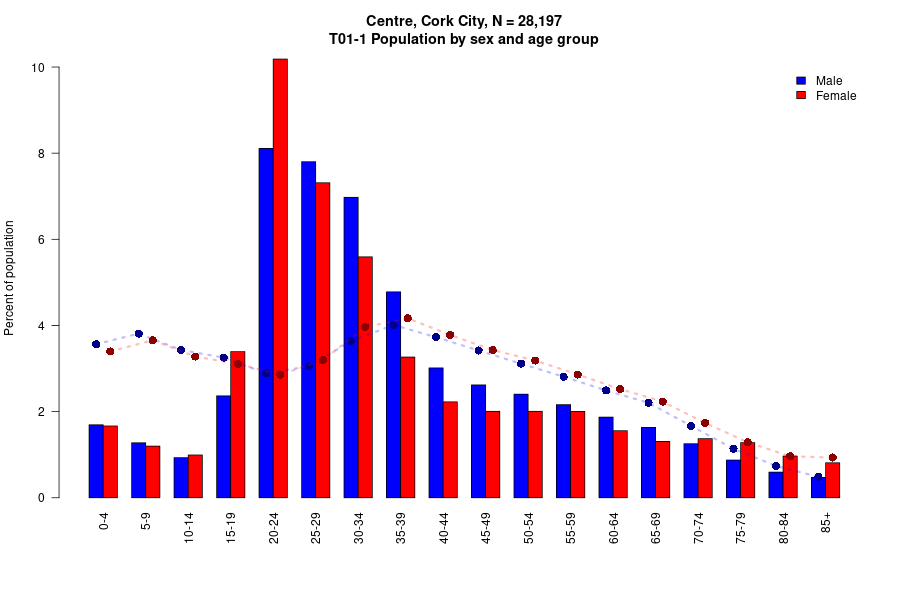
There is a clear gradient from national or county level, through city level to the city centre in several key characteristics. Fewer women – a majority of the population over 25 – are resident in Cork City than in the County, and even fewer in the city centre. Fewer children live in the city, and are especially unrepresented in the centre. There is a large excess of young people, with an over-representation of men, aged 20 to 39 years. Women only outnumber men at ages 19 to 24 years, and are primarily students who exit the city after their studies. The city and centre are characteristically young and male.
The proportion of children indicates that most families exit the city very early in family life, at or before the birth of their first child, with increasing pressure to move as families grow in size.
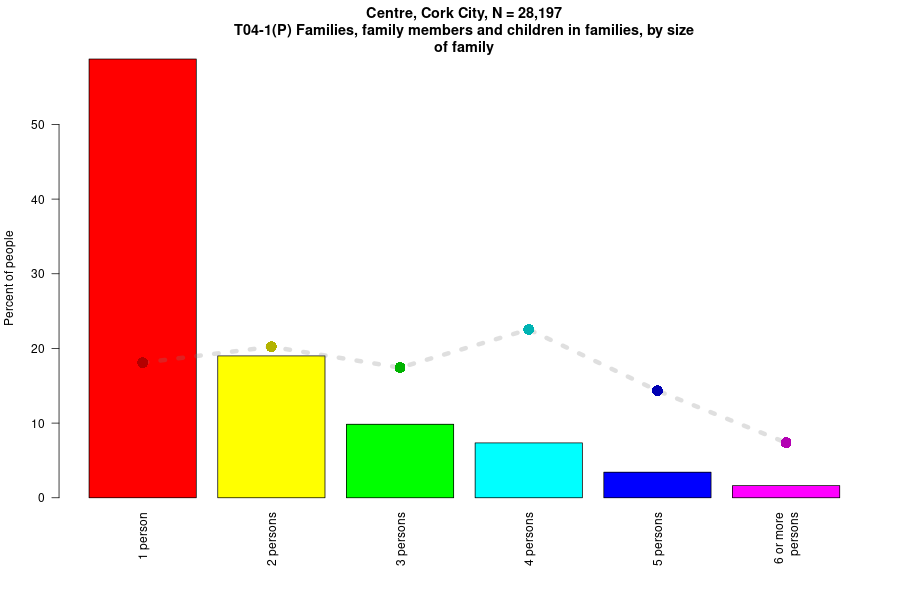
Single people are also over-abundant in the city, reaching over 60% of all households in the city centre. There is an evident question here of why dwellings that appear to be acceptable to young, single men are not equally attractive or available to young single women. As this trend towards young, single men accelerates, it will become a self-reinforcing selection, with a city centre of pubs and takeaway food more suitable for stag nights than for family living.
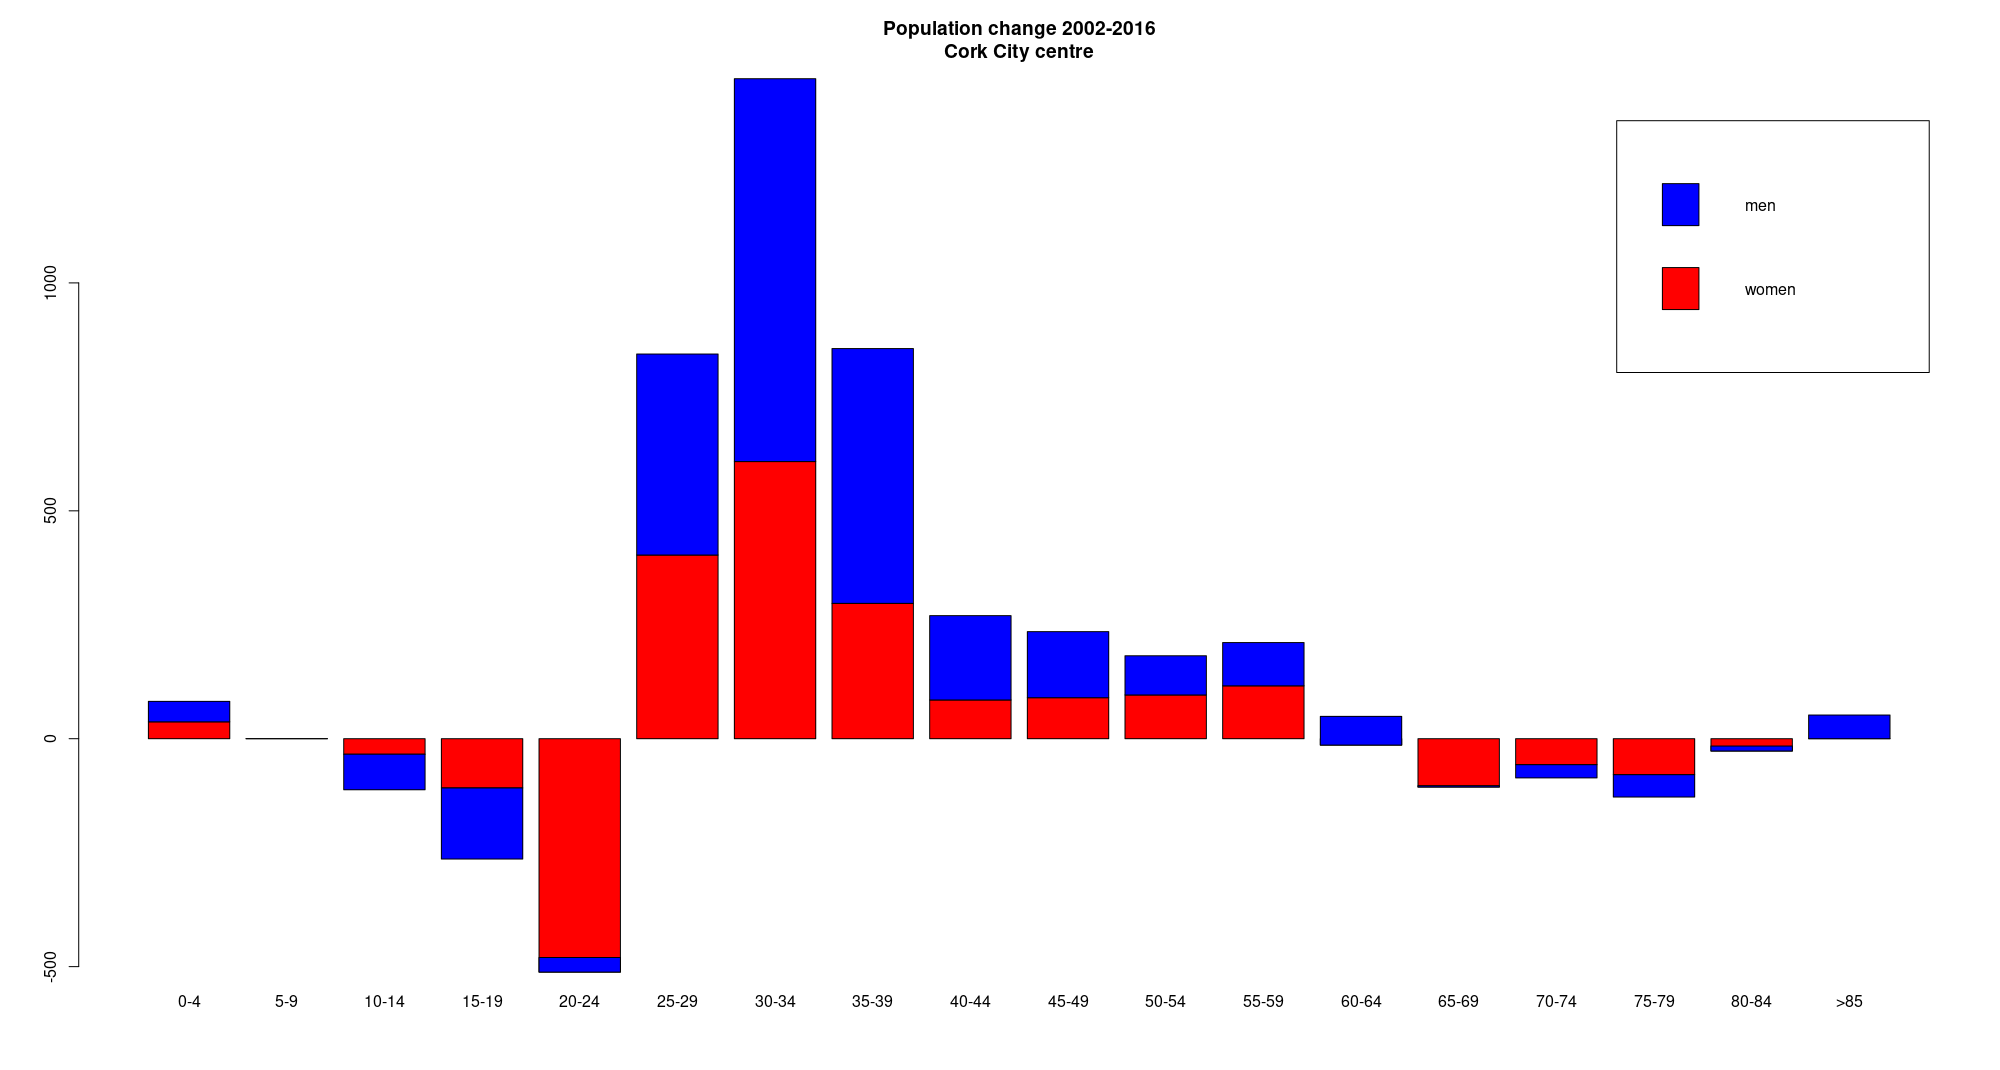
There is nothing inevitable about a stag-party city, and comparison of the 2002 and 2016 populations shows a net decline in children and older people, with a net decrease in the population of women, and a net increase in the population of men, especially young men. The style and volume of new, small apartments is a probable factor appealing to young men and not appealing to young women or suitable for families.
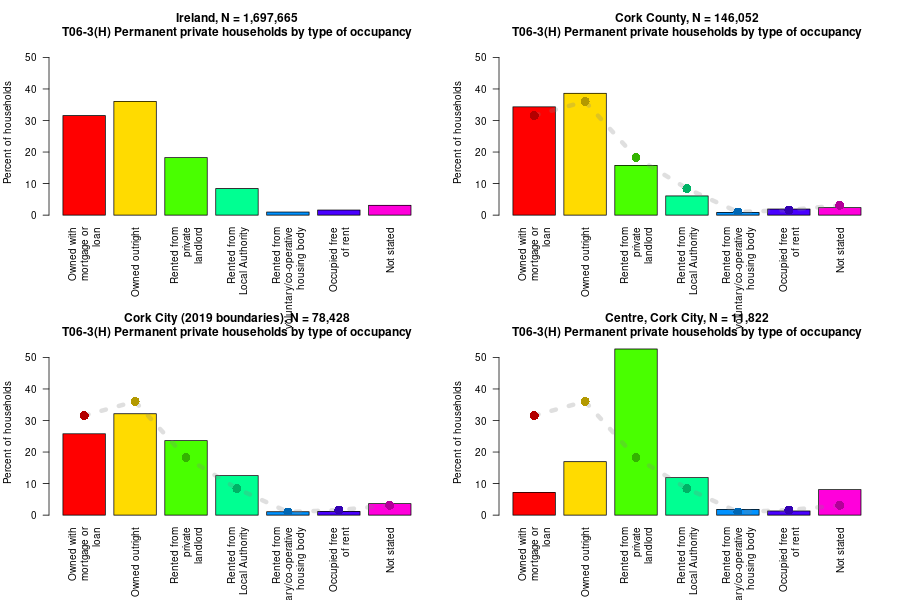
What is inevitable is the need for pressures acting on landlords and developers to meet the housing needs of a sustainable city population. If we expect to live, form families, grow old, become sick and die with dignity in our own homes, the city is increasingly less able to support us. The majority of dwellings in the city centre are privately rented, with a large volume of unoccupied property in the hands of speculators and developers.
Excluding children and families

(The maps in this post display a population centroid as a white point, a walkable “centre” area, the higher density 2016 Cork City boundary and the lower density outer suburbs added by the 2019 boundary changes – see Definitions below for further explanation.)
Children are, simply and effectively, excluded from residence in the city by the absence of 2-bedroom and larger dwellings. The lack of play space, safe outdoor exercise space and perceived or real dangers also drive families out early in the family cycle, to areas with appropriate dwellings.
The resources necessary to children, from schools through health to passport offices, have not moved at the same rate. Children spend more time commuting (and commuting by private vehicle) than ever before, and are less independent. Sustainable travel and lifestyles must start with ensuring that children are able to reside in the same locations as the resources they need to access.
Excluding girls and women
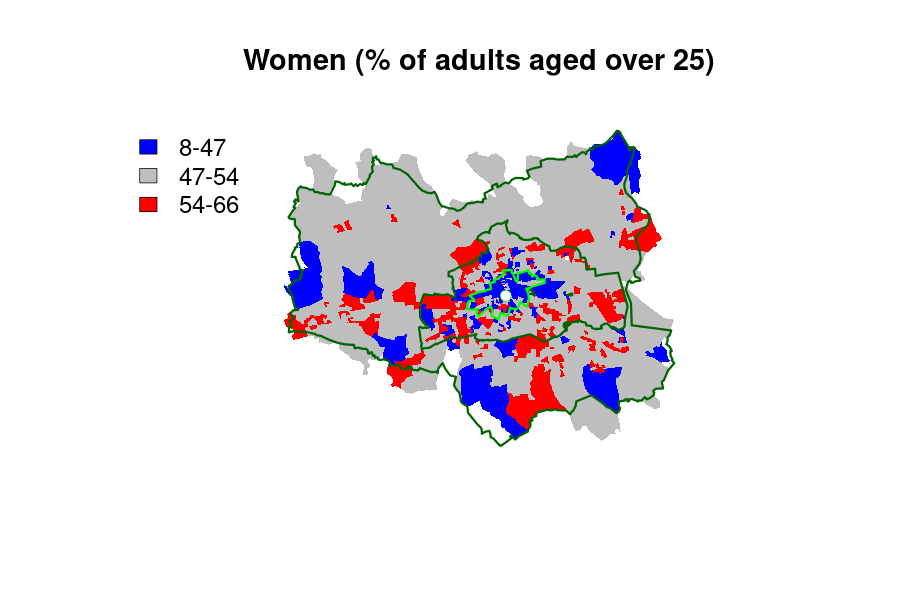
The gender ratio in Cork City ranges over an astonishing 92% male / 8% female at the most masculine extreme to 44% male / 66% female at the most feminine extreme, with a concentration of male areas in the city centre. Women are a majority of residents around the higher level education institutions and the city hospitals, and in a number of isolated areas containing nursing homes.
The neglect of older buildings, shared internal communal space in apartment blocks and male-dominated public outdoor space may all play a role in why young, single women choose not to live in Cork City. Living outside and working inside the city is a tax on women’s lives, and a significant contribution to unsustainable energy and travel.
A tax on girls’ and women’s lives
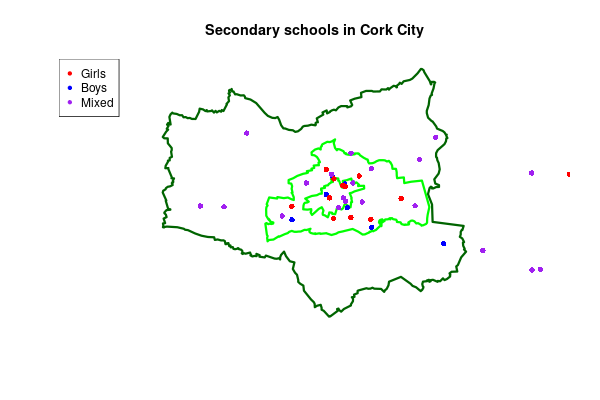
It is notable that, as a consequence of Cork City’s historical growth, there are 11,266 primary school places within the 2016 city boundaries, but only 9,456 resident primary-age children, meaning at least 1,810 (16.1% of all primary school children) commute from the outer suburbs or county into school. There is an excess of boys’ single-sex primary places (2,891) over girls’ single-sex primary places (1,920), and some evidence that families with boys decide to move earlier in their family cycle, as this may affect the choice of where to relocate.
However, there is an even greater disparity at secondary age (by which time location is more established), with 11,266 secondary places and only 8,661 resident secondary-age children, meaning at least 2,605 (23.1% of all secondary school children) commute from the outer suburbs or county into school. The disparity is even greater for girls, with a higher proportion of girls’ school places in the 2016 city boundary, and at least 26.6% of girls commute as opposed to 19.5% of boys. An additional side-effect of the school roll numbers is a higher proportion of girls attending single-sex secondary schools with a resulting gender imbalance in mixed schools, with 1,738 boys and 1,182 girls, a ratio of 1.5 to 1 (i.e. 20 boys and 10 girls in an average mixed secondary school class).
The tax on girls’ lives continues into early employment and adulthood, because journey times are significantly shorter in the city and the city centre than in the county or Ireland as a whole. The average commuting distance of city residents is 5.8 km, whereas for people who live outside and attend school or work in the city the average journey is 14.6 km. The vast majority of city dwellers have commutes of less than half-an-hour. More residents walk or cycle to work in the city than the county, and walkers are a majority in the centre. Displacement from living in the city, through unsuitability, insecurity or unavailability of housing, is a tax on women’s lives.
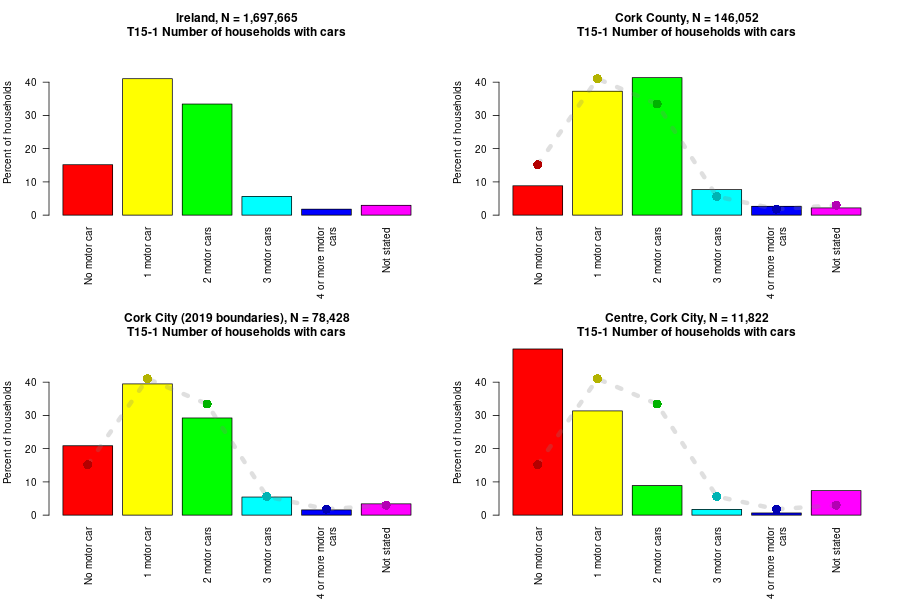
Sustainability must include both social and environmental factors. The majority of city centre residents live in car-free households, commuting by foot or cycle, and to some extent by public transport. The average commute distance is just 5.8 km in the whole of Cork City, readily walked or cycled by most people.
However, sustainability means nothing if it is not universally available. Unless the social structure of the city is also sustainable – so that people can grow as families, be cared for or care for sick family members and age gracefully – the city will increasingly become a zone for transient, early career singletons with no attachment or cohesion with the city.
Sustainable development and reversing dereliction
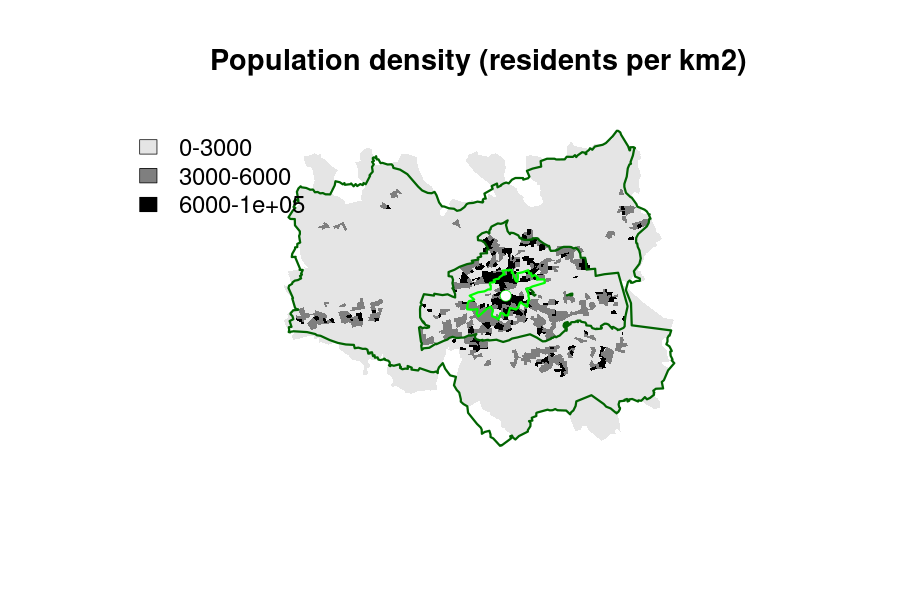
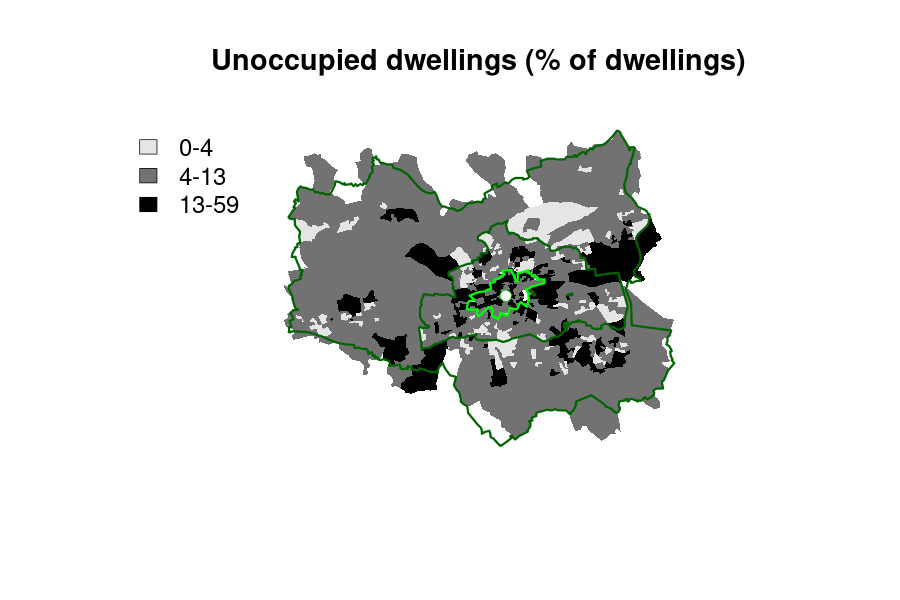
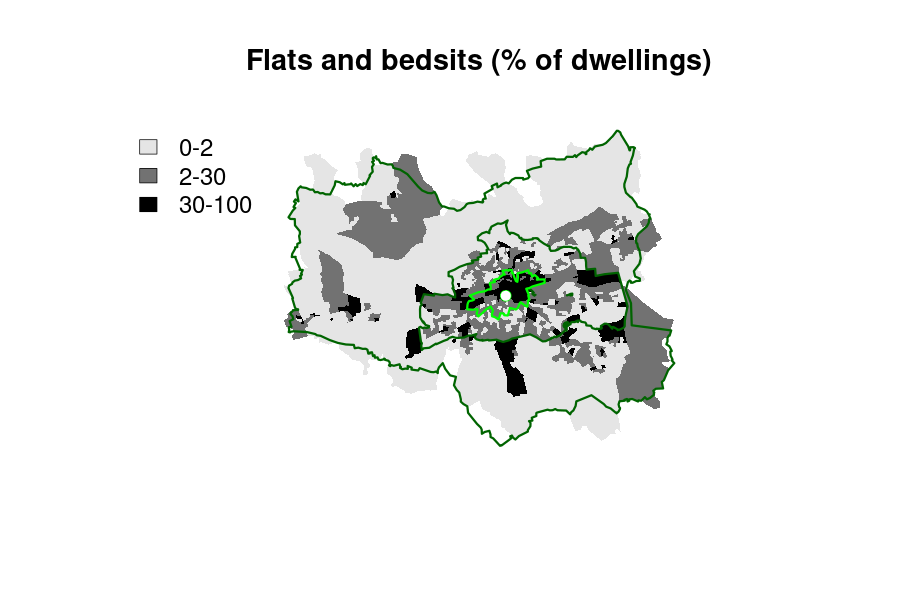
Excessive intensity of development and dereliction are twin prongs of the same unsustainable trajectory imposed by property speculation and development. We are constantly told that “we need to build up, and avoid urban sprawl”. The vast majority of Cork City’s surface area has a population density of 3,000 people per km2, but developments exceeding 20,000 people per km2 are increasingly common. They are unnecessary, do not appeal to sustainable communities and (as the pandemic has illustrated) are unhealthy and uncomfortable places to be confined in. Over 3% of dwellings in Cork city centre are “Temporarily vacant” and a further 12% are “Other vacant dwellings”, with a total of 15.9% (1 in every 6 dwellings) unoccupied. There are 8,296 vacant dwellings across Cork City and 2,290 vacant dwellings in the city centre alone (according to the 2016 Census, with a new Census due this year). At the same time, approvals of hotels, high-rise “serviced apartments” (which are not usually permanent homes) and luxury apartments have reached unprecedented levels. Construction of homes for sale or family rental and of social homes has virtually ceased.
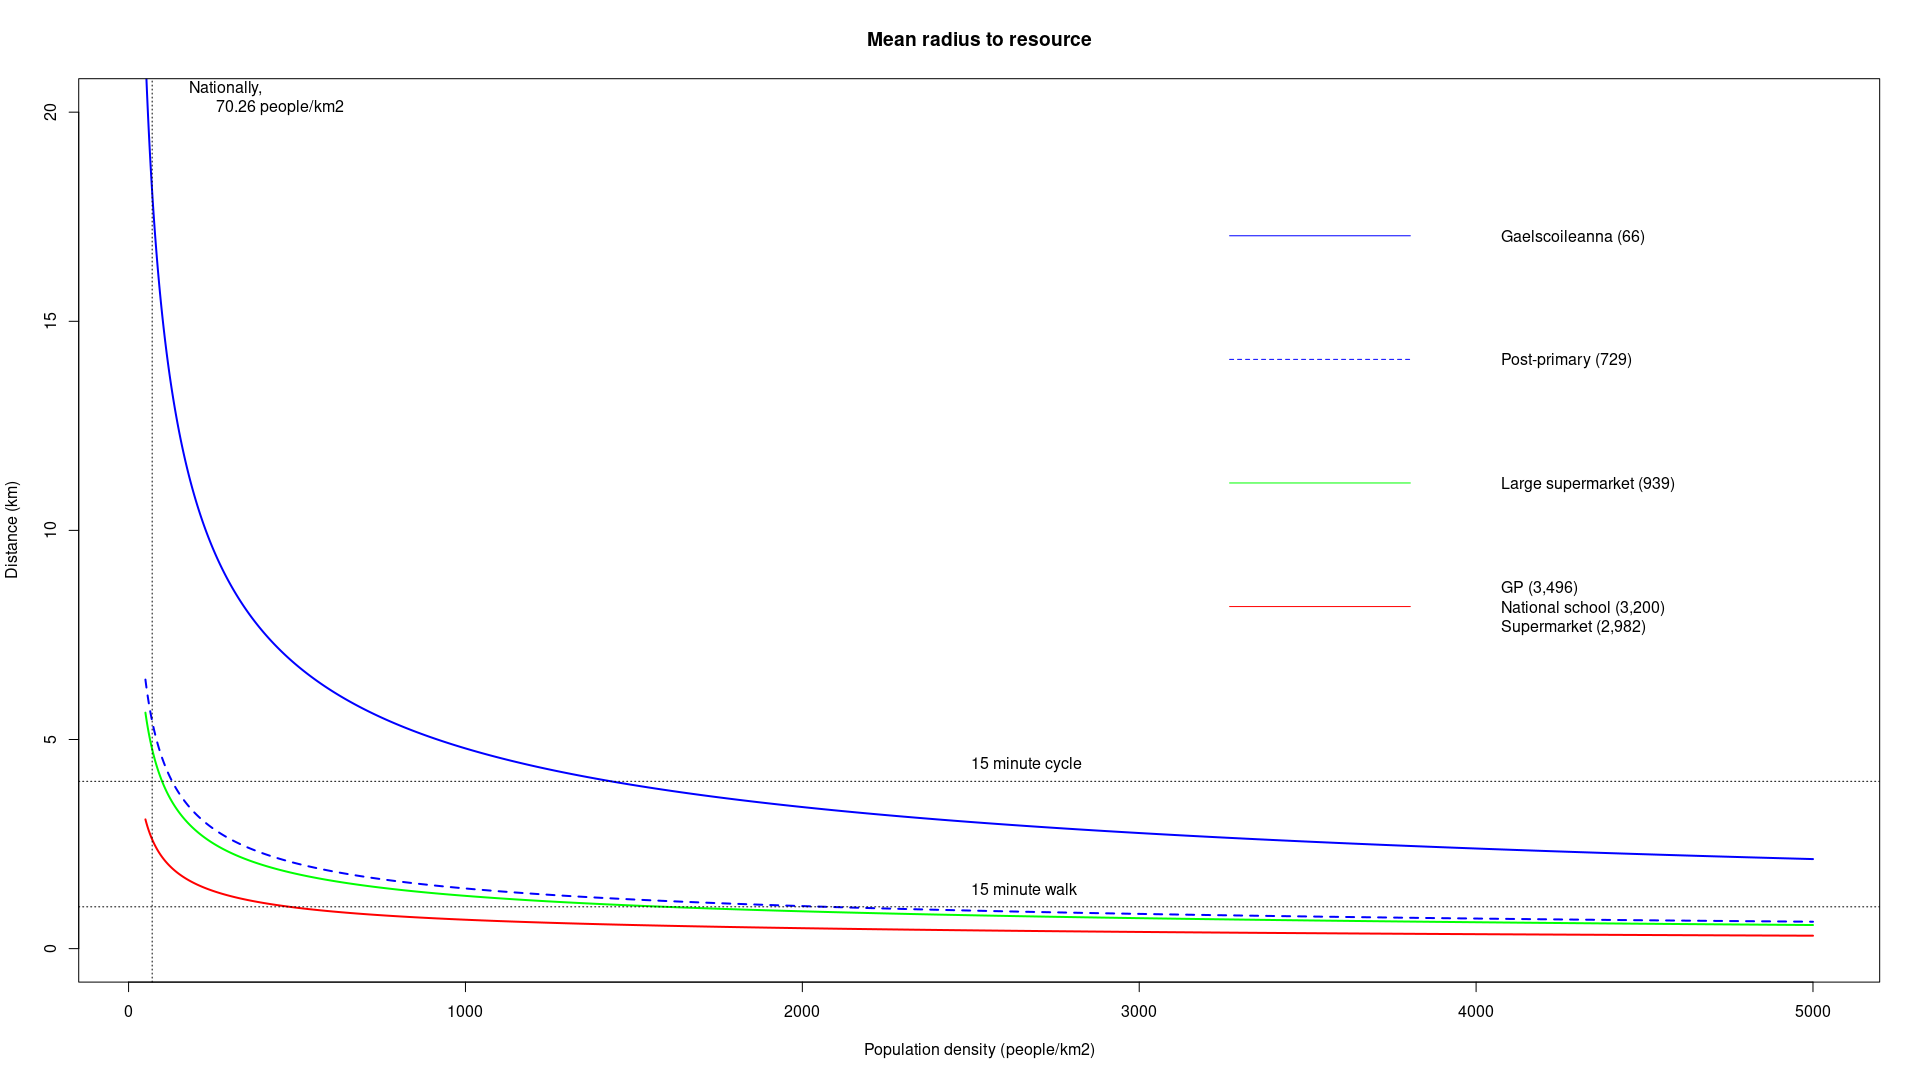
Sustainable development should focus on creating “15-minute lifestyles”, ensuring residents can access everyday resources within a hypothetically easy walk or cycle ride. The population required to support a typical large supermarket, for instance, is around 1,000 people, who would all be able to live within a 15-minute walking radius at a density of 3,000 people per km2. This vastly exceeds the density of most of the land area of Cork City (just 40 per km2 in its most rural, and 350 per km2 in some suburbs), but is the average for the 2016 boundary city.
Definitions
Cork City is defined by the 2019 boundary changes. The correct outline is displayed in maps above, but the 2016 Census Small Area Populations necessarily approximates the boundary, because the old areas are not an exact match.
Cork City in the 2016 Census contained 125,657 people within an area of 39.6 km2, a density of 3,176 people / km2. Cork City grew by 86,266 people and by 161.9 km2 with the boundary change. The population density of the outer ring, by which the city grew, is just 533 people / km2.
The “centre” of Cork City could be defined as the boundary of Electoral Divisions Centre A and Centre B (on St. Patrick’s Street), or by the population centroid of residents in the 2019 boundaries (on Proby’s Quay, by Elizabeth Fort). The population centroid is shown on the maps above. A central area of Cork City is also displayed, defined by an area equally walkable from the centroid, consisting of the Electoral Divisions Centre A, Centre B, City Hall A, Evergreen, Gillabbey A, Gillabbey B, Gillabbey C, Glasheen B, Greenmount, Gurranebraher C, Mardyke, Shandon A, Shandon B, South Gate A, South Gate B, St. Patrick’s A, St. Patrick’s B, Sundays Well B and The Lough. The population of the city centre is 27,170 people in an area of 4.8 km2, a population density of 5,709 people / km2 – almost twice the density in the rest of Cork City.
Resources
- Population statistics: Central Statistics Office (CSO), Census 2016 Small Area Population Statistics (SAPS)
- Electoral Division map: Central Statistics Office (CSO), Electoral Division Boundaries