Two contrasting approaches to predicting (guessing) the outcome of an epidemic are 1) projecting data from similar situations observed in the past; and 2) modelling from varying degrees of first principles. Models must match reality for any reasonable usefulness, but are often extremely sensitive to intitial (unknown) conditions and the slightest variation in input parameters.
Here are both approaches, in broad outline, to generate boundaries around expected outcome.
NB1: Code in R (requires population and death or case time series)
NB: My thesis “Mathematical modelling of inherent susceptibility to fatal diseases” has some relevance, but not to epidemic modelling.
Modelling
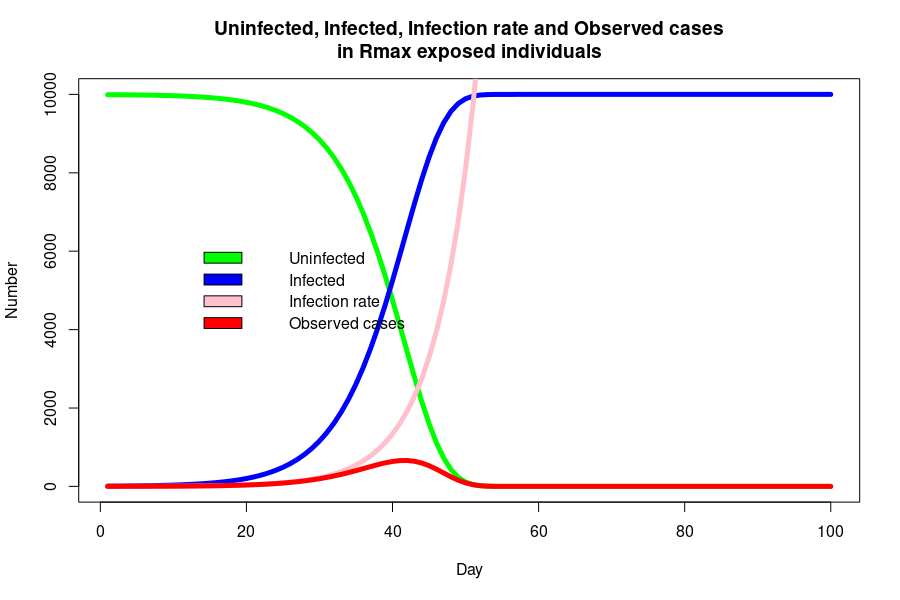
Epidemics typically follow, in the intial stage, an exponential growth function. Each infected person infects a similar average number, like each euro accruing the same interest in compound savings growth. The exponential function is:
[1] r(t) = R₀∙exp(a∙t)
where R₀ is the presumed number infected at time t=0 days;
exp(a) is the daily growth rate, e.g. exp(0.1823) = 1.2 (20% per day)
The number of infected cases at time t is a function of the number at risk, Rₘₐₓ, an unknown end-point when all of the people at risk of infection have been infected.
The uninfected proportion proportion (‘survival rate’) of the population at risk is:
[2] S(t) = exp(-R₀/a∙exp(a∙t))∙Rₘₐₓ
The cumulative number of cases (infected people) is the remaining fraction of the at risk group:
[3] R(t) = (1 – exp(-R₀/a∙exp(a∙t)))∙Rₘₐₓ
The number of new cases at day t is the product of the infection rate [1] and the survival rate [2]:
[4] r(t) = R₀∙exp(a∙t)∙(1 – exp(-R₀/a∙exp(a∙t)))∙Rₘₐₓ
Can we fit R(t) to cumulative cases, or r(t) to new cases? Is there any value in the model parameters?
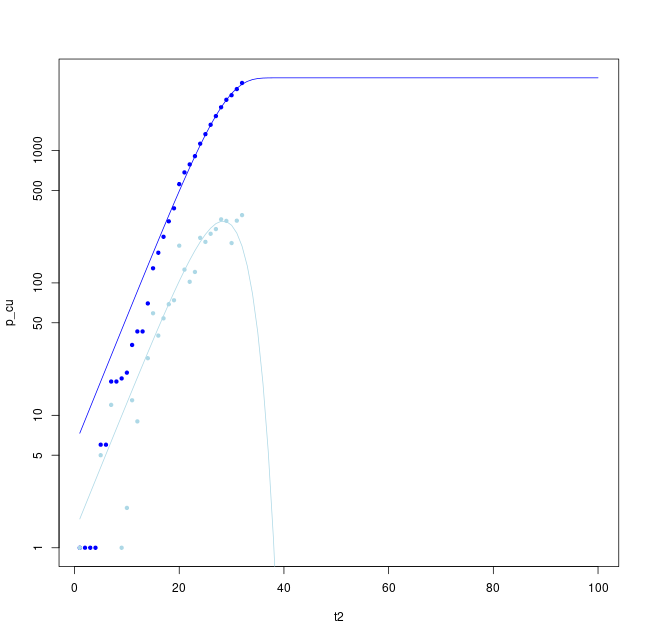
Fitting either the cumulative case rate (upper blue line) or new cases (lower pale blue line) provide an estimate of the peak rate, final number infected and end time of the peak. These parameters are fit for the most recent data for Ireland above.
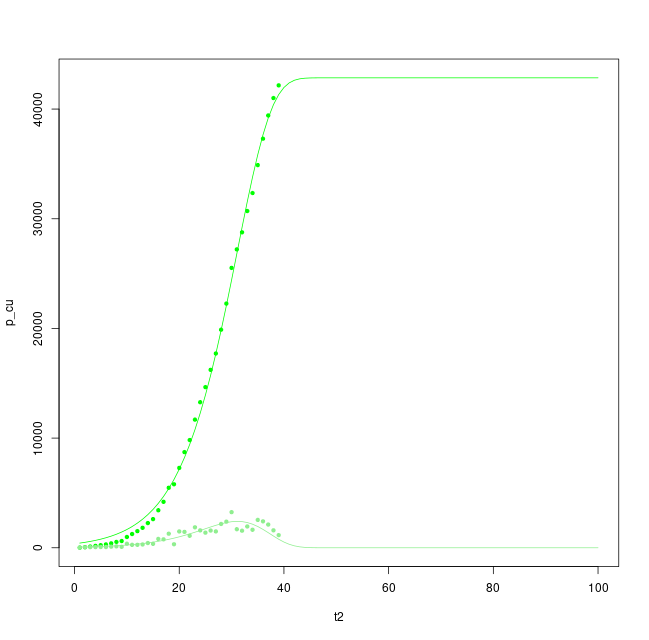
Likewise for Lombardy, a region with clearer signs of a peak, levelling of rates and possible reduction towards the end of the regional epidemic.
How reliable are these modelling predctions? (Not very reliable).
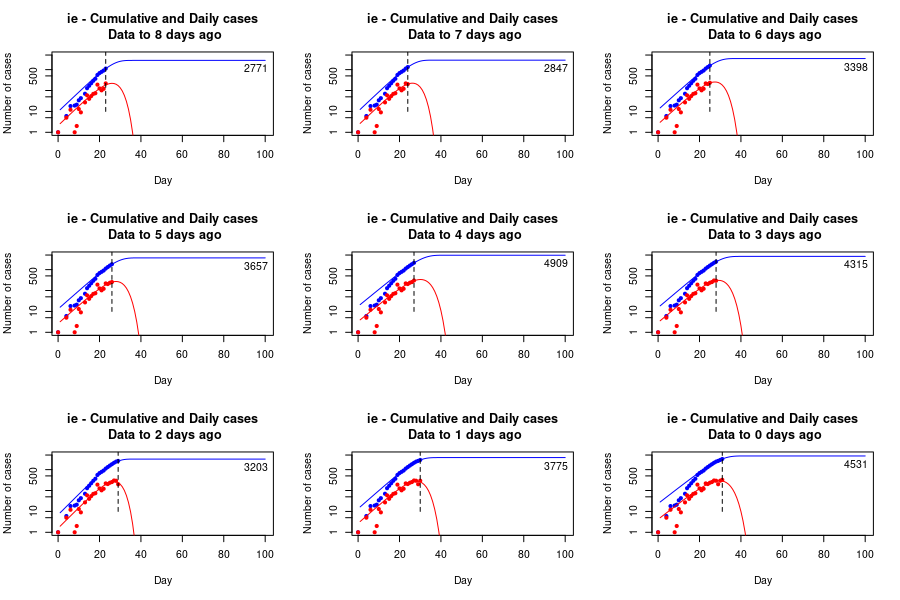
Fitting daily rates for Ireland shows the sensitivity of fitting to small variations in daily rates, particularly in the largest value observed to date. However, the peak is predicted to last about 40 days from first case, with a relatively stable upper limit and a final value of infected cases ranging from about 3,000-5,000 cases. Each additional day of data provides greater stability to the estimate.
(NB: It seems to me that rates decline too fast, and perhaps a power of S(t) is appropriate in estimating infectious growth, which is to say the probablity of infecting another person declines as a power of the proportion already infected).
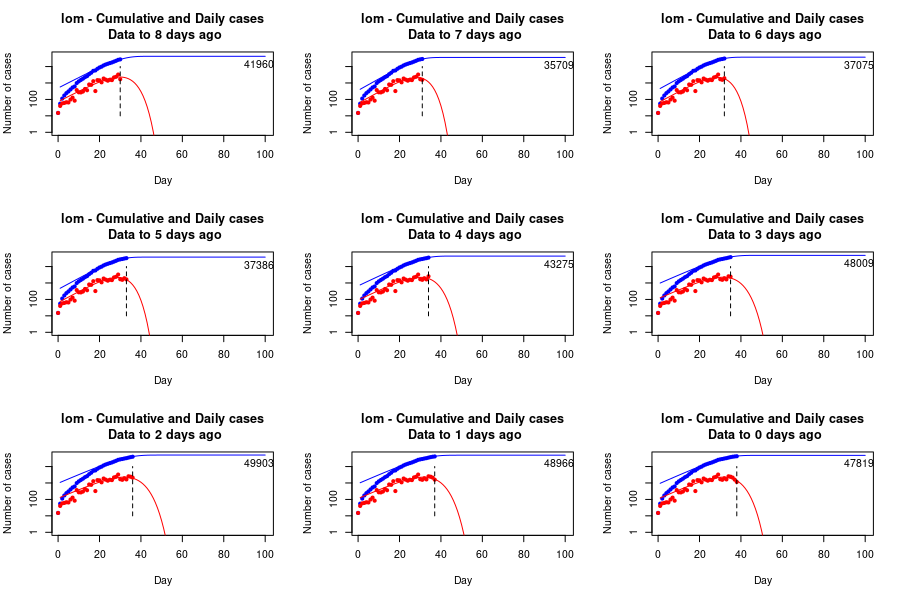
Lombardy, fit to the most recent data and to the data available up to each of the preceding 8 days, indicating a longer epidemic phas of about 50 days, higher peak and final infected number of around 50,000 individuals.
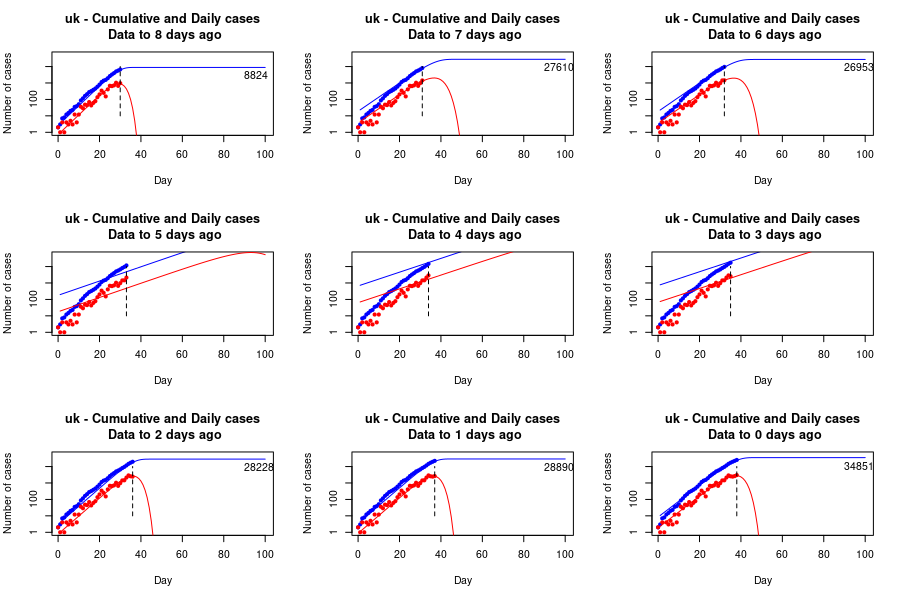
UK data up to each of the past 8 days and most recent day, possibly levelling to around 30,000 cases by around day 45, but the fit is unstable and failed on days 2-4 before the present, indicating a lack of confidence in leveling (or the quality of confirmation data).
Projection
Projection is more straightforward and provides a robust estimate of how a second population would be impacted if subjected to the same effect a first population, i.e. a repeat of an observed historical phenomenon.
For instance, there were 80,796 cases, 4,257 critical cases and 3,169 deaths attributed to covid-19 in China, with a population of 1,435 million. This is 56.1 cases per million, of which 5.3% were critical and 3.9% died. This would equate to 276 cases in Ireland, with a population of 4.92 million, assuming all circumstances and population characteristics were identical.
(NB: these are very broad brush projections. To project with greater precision – which is not necessarily greater accuracy – the age-specific rates and other characteristics need correctly mapping to the second population).
However, the epidemic in China was concentrated in Hubei Province, almost entirely within Wuhan City, with a population of just 11.08 million. There were 67,743 cases and 3,007 deaths in the province. This amounts to 6,113 cases per million (0.6% of the population) and 271 deaths per million (0.03%). These would equate to 30,076 cases, 1,503 critical cases and 1,333 deaths in a population the size of Ireland, 4.92 million.
Likewise there were 1,138 cases per million and 112 deaths per million in Italy, with a regional concentration that was highest in Lombardy. Here the rates were 2,853 cases per million and 374 deaths per million (and still rising). These would equate to 14,037 cases and 1,840 deaths in a population the size of Ireland.
These two regional epidemics are the only epidemics with a peak that has either levelled or declined, and the best guide to a reasonable scenario for Ireland, assuming similar social restrictions and case testing, identifications and isolation.
(The two regions, and their national situations, are also the best guide to the long-term economic, social and psychiatric impact of financial shutdown, individual trauma and disruption of all health and social welfare).
A very unnatural circumstance (and one that seems set to be repeated in other enclosed groups without proper separation of quarantine and isolation) is that of the passenger and crew complement of the Diamond Princess. They were quarantined on board the vessel, with positive cases removed and isolated for treatment in a well-equipped onshore facility. There were 696 cases, 32 critical cases and 7 deaths in 3,711 passengers and crew. This is 187,551 cases per million (18.7%), 8,623 critical cases per million (0.9%) and 1,886 deaths per million (0.2%). This would equate to 922,751 cases, 42,425 critical cases and 9,279 deaths in a population the size of Ireland.
Whilst the final Diamond Princess projection is an extreme upper bound useful for planning, it seems unlikely. However, it is most notably similar to the alleged UK ‘herd immunity’ strategy of allowing the epidemic to “burn through” the population, “culling” the most vulnerable (unless they are ‘cocooned’ whilst the less vunerable taking their chances getting immunity through live virus infection). If this strategy has not been entirely abandoned – as the low rates of testing, slow response in social restrictions and general inaction in the UK suggest – Ireland will remain vulnerable to further epidemic growth from newly introduced infection.