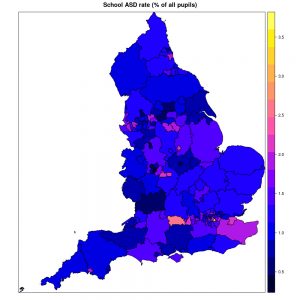
 The Office for National Statistics (ONS) produces comprehensive data tables about the UK, including tables of special needs provision in schools across 152 local authorities in England. Special needs are categorised within this data by primary need, including ASD. The overall rate is 1.26% of all state-funded school pupils, ranging from about 0.5% in the local authorities with the lowest rates to about 3.5% in the authorities with the highest rates. This provides a good example of what may possible when the Autism Bill is enacted. Mapping the distribution raises many interesting questions about the reasons for regional variation, changing rates of ASD and whether there is inequality in provision.
There are important warnings about the data. The distribution of ASD is according to the school’s local authority, not the pupils’ home residence. The schools are primary, secondary and special schools, so there is no data for any adults. The special needs category is “primary need”, so the data excludes autistic pupils The special needs categories are only provided for state-funded schools, so no private or other non-state education is included.
Autism in primary, secondary and special schools
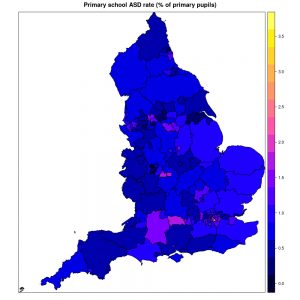 The proportion of primary pupils with a primary ASD provision is 0.84% (38,944 of 4,615,172 primary pupils), with a notably higher rate in urban areas. The primary school ASD rate in the top 10 LAs is 6.4 times that in the bottom 10 LAs.
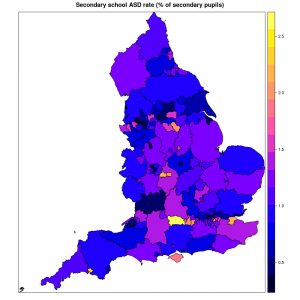 The proportion of secondary pupils with a primary ASD provision is 1.05% (33,596 of 3,193,418 secondary pupils), again with notable regional variation and higher rates in urban areas. The secondary school ASD rate is 4.9 times higher in the top 10 LAs than the bottom 10 LAs.
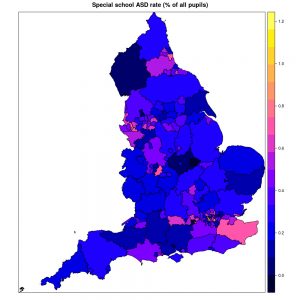 Special school numbers cover all school ages, but the rate of ASD as a primary need in special schools is an additional 0.32% of all pupils, primary and secondary (27,472 of 8,559,540 pupils). The variation in special school rates is a factor of 9.2 between the top and bottom LAs, because there are fewer special schools.
Again, it needs stressing that these are the proportion of pupils provided with special needs resources where ASD is the primary need, in the LA of the school and not the pupil’s home LA. Rates will be higher if an LA is well-resourced, attracts pupils with special needs, has larger schools (and hence more SNAs), or has a historically higher base of special schools or resource provision.
What predicts ASD rates in school?
The ONS publishes a huge array of data from the census and local area statistics, so there are many potential factors to examine, and the data is publicly available (links below) for anyone who cares to examine their own hypotheses.
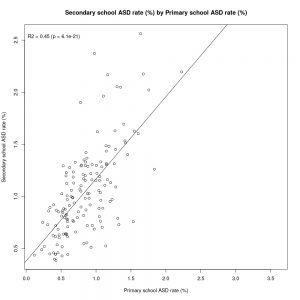 One very obvious association is the rate of ASD in secondary schools is proportional to that in primary schools (R²=0.45, p<0.001), because they represent an older cohort of the same population and also because primary provision is likely to be echoed in secondary provision. This is not just stating the obvious – pupils with resources at primary level will demand resources at secondary level, modifying secondary school provision. It is possible that failure to identify ASD at primary level also leads to under-resourcing at secondary level, and that areas with low resource provision are failing to identify and address need.
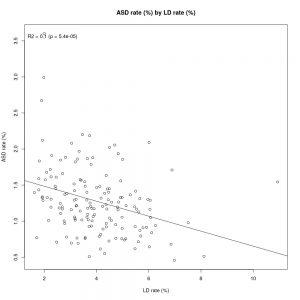 A much more interesting negative association exists between learning difficulty and autism (R²=0.1, p<0.001). “Learning difficulty” here includes “Moderate Learning Difficulty”, “Severe Learning Difficulty” and “Profound & Multiple Learning Difficulty”. The negative trend indicates that there may some diagnostic substitution between LD and ASD, with ASD replacing LD as a diagnosis in LAs with higher rates of ASD. The same process may be responsible for a large element of the rise in rates of ASD in recent decades, along with expansion of autism to a broader spectrum that includes people who would have had no diagnosis in earlier decades.
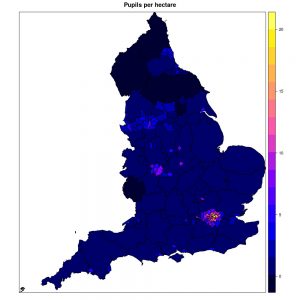 Other interesting, statistically non-significant associations exist between the ASD rate and education expenditure per head (R²=0.12), net LA expenditure on all purposes (R²=0.17), gross household income (R²=0.17), population density (R²=0.016) and pupil population density (R²=0.014). At the level of a local authority it is not possible to determine whether school resources lead to diagnosis, diagnosis to resourcing, or whether family income leads to greater resourcing, but the indications are there.
As with the distribution of special needs in Ireland, it seems that social processes are a factor in variations over place and time. Large schools in areas with a high pupil density, higher state expenditure and greater family income might all contribute to greater recognition and resourcing of autism.
Data sources
- Ordnance Survey boundary data for the UK, in Local Authority and other output levels
- ONS special needs data for England, by primary, secondary and special schools (for state-funded schools)
- Other census data is available from the ONS, matched by Local Authority code